Prometheus & Grafana Setup on Kubernetes
Introduction
Behind the trends of cloud-native architectures and micro-services lies a technical complexity, a paradigm shift, and a rugged learning curve. This complexity manifests itself in the design, deployment, security, and everything that concerns the monitoring and observability of applications running in distributed systems like Kubernetes. Fortunately, there are tools to help the DevOps team to overcome these obstacles. For example, at the observability level, tools such as Prometheus and Grafana provide enormous help to the developers’ community.
In this blog post, we are going to see how to use Prometheus and Grafana with Kubernetes. We are going to see how Prometheus works, and how to create custom dashboards. Then we’ll dive into some concepts and talk about which metrics to watch in production and how to do it.
Requirements
Some basic knowledge of Kubernetes is assumed, and the code for this tutorial will be deployed into a Kubernetes cluster running in minikube/GKE/EKS.
Installation and configuration
You will need to run a Kubernetes cluster first. You can use a Minikube cluster or deploy a cloud-managed solution like GKE or EKS. In this article, we’ll use GKE.
We are also going to use Helm to deploy Grafana and Prometheus. If you don’t know Helm, it’s a package manager for Kubernetes — it is just like APT for Debian. The CNCF maintains the project in collaboration with Microsoft, Google, Bitnami, and the Helm contributor community.
Helm Setup
Helm can be installed by running the following command on a Mac OS (the windows and linux equivalents can be found on the helm documentation page):
$ brew install kubernetes-helmOnce helm has been installed, it needs to be initialised by running the following command:
$ helm initThis process does two crucial tasks, it initialises the local helm client and installs the tiller server within the Kubernetes cluster which handles all the helm packages to be deployed.
Helm works by taking a set of values (usually written in the values.yaml file) and applying them to predefined templates called Charts. Think of Charts as all the collection of files that describe the Kubernetes resources which include, Services, Pods, Persistent storage volumes, Configmaps etc. that the application will require to function optimally.
For our use case, we will be using the stable Charts from the Kubernetes project repository. We will focus on two approaches; in the first approach, we will download the Charts to the local repo, and edit the values.yaml file and deploy this local Chart. In the second approach, we will edit the values.yaml file and apply them to a stable Chart directly from the Kubernetes repo. Both have their advantages and disadvantages, you can choose whichever approach addresses your use case.
To have a better grasp of the manifest files that will be deployed and the options the values file takes, we will add the stable Charts into our codebase before making the necessary edits. To search for available helm Charts in the Kubernetes stable repo, the command is:
$ helm searchThis will return a list of Charts where each chart has the format stable/<chart_name>.
To download the necessary chart to our repo, the command to run is:
$ helm fetch stable/<chart_name> --untarThis returns a tar version of the chart, the helm cli tool provides the --untar convenience argument to convert it to a regular folder ready for use.
To deploy to the cluster, it might be necessary to edit the values.yml file in the chart according to the requirements. The edits may include; changing the storage size, configuring which pods to install, updating credentials etc. (more on this later). Finally the chart can be added to the cluster by running:
$ helm install ./<chart_name>Prometheus
Prometheus is an open-source monitoring and alerting metric collector with a time series database. It was taken in by the Cloud Native Computing Foundation (CNCF) as the second hosted project after Kubernetes.
Prometheus with Helm:
It is a good practice to run your Prometheus containers in a separate namespace, so let’s create one:
kubectl create ns monitorThen, proceed with the installation of the Prometheus operator:
To fetch the helm chart, the following command needs to be run:
This will download the prometheus chart to your local machine.
$ helm fetch stable/prometheus --untarOnce the chart is downloaded, open the values file found in location prometheus/values.yaml. Though it contains a number of options, there are only a few options we need to worry about initially. The first is:
rbac:
  create: false
This option creates the role-based access control and is beyond the scope of this tutorial. However I found that leaving it as true, led to deployment issues in my minikube environment, so it’s turned off to ensure the deployment will still work.
The other option you might want to consider is the size the of the persistent volume, this can be set individually for the alertmanager and the prometheus server using the size variable:
size: 2GiThere are several options which are set to true but are not necessary, these includes the alertmanager, pushgateway etc, setting them to true or false doesn’t adversely affect our deployment. You can read up on the documentation to figure out if it covers your use case. Once we have made the necessary edits to the values file, the prometheus chart can be added to our deployment by running:
$ helm install ./prometheusThis returns a slew of information which has the following structure:
NAME:   test
LAST DEPLOYED: Tue Apr 17 00:41:16 2022
NAMESPACE: default
STATUS: DEPLOYED
.
.RESOURCES:
.
.NOTES:
.
.
The NAME variable is the release name of the helm deployment for prometheus. This allows us to update, delete and inspect the deployment based on the release name e.g. helm delete <RELEASE_NAME>. To see a list of running helm applications according to their release names, the command is:
$ helm lsYou can verify your installation using:
kubectl get pods -n monitorYou should be able to see the Prometheus Alertmanager, Grafana, kube-state-metrics pod, Prometheus node exporters and Prometheus pods.
NAME                                                   READY   STATUS    RESTARTS   AGE
alertmanager-prometheus-operator-alertmanager-0        2/2     Running   0          49s
prometheus-operator-grafana-5bd6cbc556-w9lds           2/2     Running   0          59s
prometheus-operator-kube-state-metrics-746dc6ccc-gk2p8 1/1     Running   0          59s
prometheus-operator-operator-7d69d686f6-wpjtd          2/2     Running   0          59s
prometheus-operator-prometheus-node-exporter-4nwbf     1/1     Running   0          59s
prometheus-operator-prometheus-node-exporter-jrw69     1/1     Running   0          59s
prometheus-operator-prometheus-node-exporter-rnqfc     1/1     Running   0          60s
prometheus-prometheus-operator-prometheus-0            3/3     Running   1          39s
Now that our pods are running, we have the option to use the Prometheus dashboard right from our local machine. This is done by using the following command:
$ export POD_NAME=$(kubectl get pods --namespace default -l "app=prometheus,component=server" -o jsonpath="{.items[0].metadata.name}")$ kubectl --namespace default port-forward $POD_NAME 9090Now visit http://127.0.0.1:9090 to access the Prometheus dashboard.
This is an expression browser for performing ad hoc querying and debugging. However, the dashboard is not intuitive and can take a lot of work to properly configure.
To have a better understanding of the metrics returned, we need to find a more user friendly dashboard, and for this we will be using Grafana.
Grafana:
Grafana is an open source dashboard tool with aesthetic analytics and monitoring, that supports the querying of prometheus.
Grafana with Helm
In order to add Grafana to our cluster, we need to fetch the stable Grafana Chart maintained by the Kubernetes project, the command for this is:
$ helm fetch stable/grafana --untarNext, we need to edit the values file found in grafana/values.yaml. The credentials and the storage configuration values can be updated according to your requirements where more secure credentials can be chosen and the persistence size can be set as well:
adminUser: admin
adminPassword: strongpasswordpersistence:
  enabled: true
  size: 4Gi
The next configuration value is the data source which is commented out by default. First uncomment it as follows:
datasources:
  datasources.yaml:
    apiVersion: 1
    datasources:
    - name: Prometheus
    type: prometheus
    url: <PROMETHEUS_URL_HERE>
    access: proxy
    isDefault: true
Then in the url field, add the prometheus url, which is the output of the following command:
echo http://$(kubectl get service --namespace default -l "app=prometheus,component=server" -o jsonpath="{.items[0].metadata.name}").default.svc.cluster.localSkipping the datasource step here will mean an extra step in setting up the data source in the UI. You can also add this data source via the UI.
The chart can be deployed in our cluster using the stable repository version and not the one we downloaded. This can be done by:
$ helm install -f grafana/values.yaml stable/grafanaWhat this does, is instead of deploying the local Chart as was with the prometheus deployment, it takes our values file and applies it against the grafana Chart in the stable/grafana repository. Both approaches are okay and it depends on your business requirements and operational best practices on which you choose.
On deploying we get a similar output as with Prometheus i.e.:
NAME:   test-user
LAST DEPLOYED: Tue Apr 17 18:35:07 2022
NAMESPACE: default
STATUS: DEPLOYEDRESOURCES:
.
.NOTES:.
.
Where the NAME is the release name. This is then followed by a list of resources, and notes concerning key features of the deployment. The notes includes the command used to perform port forwarding in order to view the deployment from our localhost browser window.
There seems to be an error with the port forwarding command as described in the
NOTES, if the port forwarding command fails, run the one below but replace the<RELEASE_NAME>with your release name.
$ export POD_NAME=$(kubectl get pods --namespace default -l "app=grafana,release=<RELEASE_NAME>" -o jsonpath="{.items[0].metadata.name}")
$ kubectl --namespace default port-forward $POD_NAME 3000
Navigate to 127.0.0.1:3000 in the local browser, where the grafana login screen is shown. Enter the credentials that were set in the grafana/values.yaml file. Once this is done you will end up in the following page:

As you can see the datasource is configured based on the values.yaml file so there is no need to set it up again. The next thing we need to do is to import a Grafana board. To do so, click the top left add (i.e. +) icon, which will show the drop down (within the red rectangle in the above image) and then click import. Alternative go to the following link http://127.0.0.1:3000/dashboard/import, where in the first input box:

Enter the value 3131, which is the unique identifier for the Kubernetes All Nodes prebuilt dashboard from the Grafana community site. Clicking anywhere outside the input field will lead to the following view displaying the dashboard options.

Set the prometheus data source to prometheus (shown in the red rectangle) and then click the import button. This should take you to the new dashboard with the basic metrics running similar to the one as shown below (give it a few minutes to start populating the data):
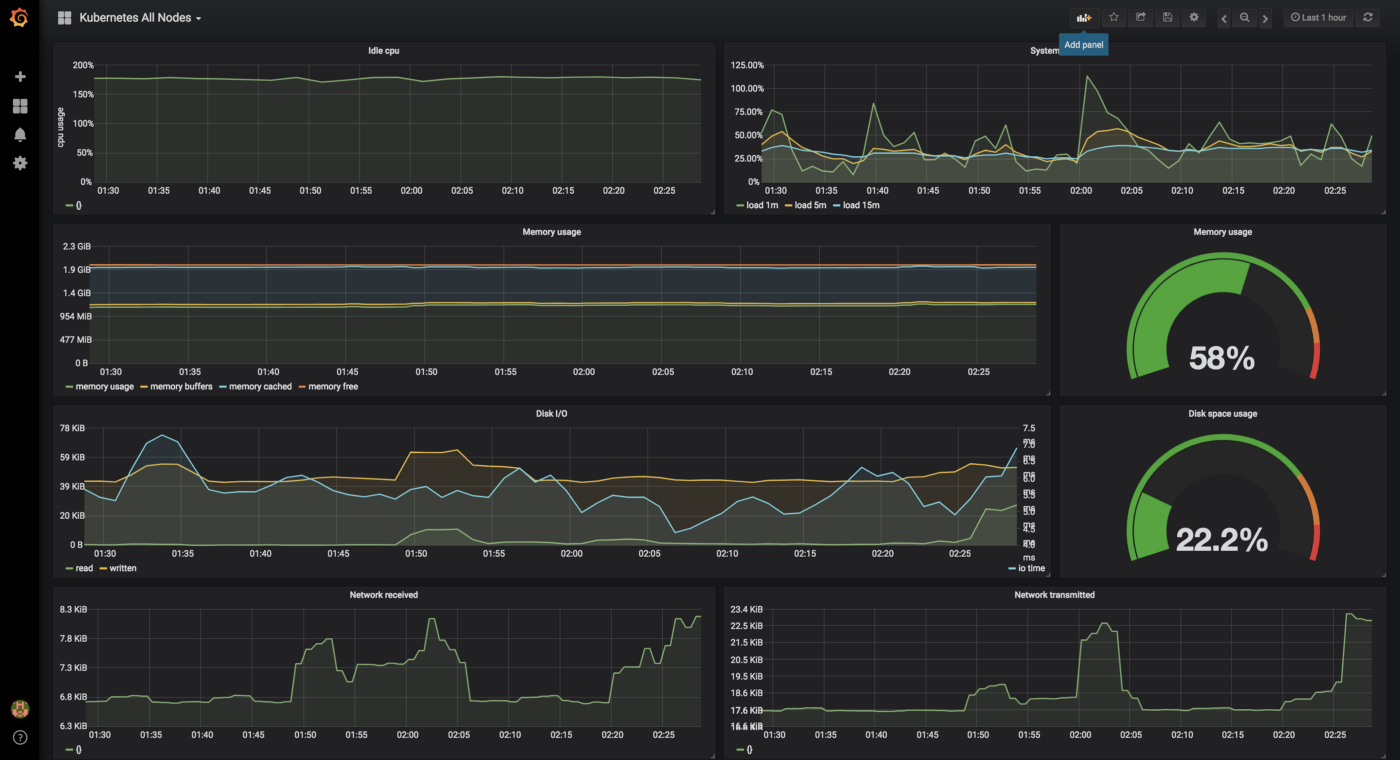
Kubernetes Dashboard
Django Application Level Monitoring with Prometheus and Grafana:
Now that we have set up cluster level monitoring, we can begin looking at how to set up application level monitoring.
Let’s consider we want to monitor django application. For this we will be using the django-prometheus package. Following the documentation, there are a few changes we need to make to our application, this includes:
- Update the
requirements.txtfile and adddjango-prometheus==1.0.13to it. - Next we need to update the
settings.pyfile as documented on the django-prometheus github page i.e:
INSTALLED_APPS = (
   ...
   'django_prometheus',
   ...
)MIDDLEWARE_CLASSES = (
    'django_prometheus.middleware.PrometheusBeforeMiddleware',
    # All your other middlewares go here, including the default
    # middlewares like SessionMiddleware, CommonMiddleware,
    # CsrfViewmiddleware, SecurityMiddleware, etc.
    'django_prometheus.middleware.PrometheusAfterMiddleware',
)
- Afterwards we need to update the
urls.pyfile as follows:
urlpatterns = [
    ...
    url('', include('django_prometheus.urls')),
]- Next we need to rebuild our docker image, from previous tutorials the command is
$ docker build -t <IMAGE_NAME>:<TAG> .. If you have been following the tutorials until now, make sure theTAGis different than what was previously used otherwise the change will not be picked up when you redeploy. - We can then update our deployment with the new
<IMAGE_NAME>:<TAG>by changing the image field ondjango/deployment.yaml:
$ image: <IMAGE_NAME>:<TAG>- The next thing we need to do is update the
./django/service.yamlfile according to:
The change is that annotations: prometheus.io/scrape: "true" was added and allows prometheus to monitor our service (we won’t go into too much detail here).
- The changes we made to the deployment and service needs to be redeployed to the cluster:
$ kubectl apply -f django/- To confirm this is working we can use minikube to show us a version of our webpage:
$ minikube service django-serviceThis should open our django application in a new browser. To see the data that is been monitored, navigate to the /metrics endpoint where you will the metrics that will be sent to the prometheus server.
To import a working Django Grafana dashboard refer official grafana dashboard section here https://grafana.com/grafana/dashboards/?search=Django
Building a Grafana dashboard is out of the scope of this tutorial. However, this is a good time to show how to view metrics on the prometheus expressionless browser. To view the metrics, execute a port-forward according to the notes provided on deploying prometheus with helm and navigate to the url provided, in my case it’s http://127.0.0.1:9090/. The following view should be shown:

From the dropdown enclosed in the red rectangle select any django metric and click execute to see see that the django metrics is indeed been scraped by prometheus.
Conclusion
In this tutorial we have seen how to install prometheus and Grafana using Helm chart and monitor applications.
Please do suggest if any changes or corrections are required. You can reach me for any queries.
Creator :
If you like this blog and find it helpful then please do share and do not forget to clap.
==================================


Comments
Post a Comment